Identifying and prioritising opportunities for cultural heritage
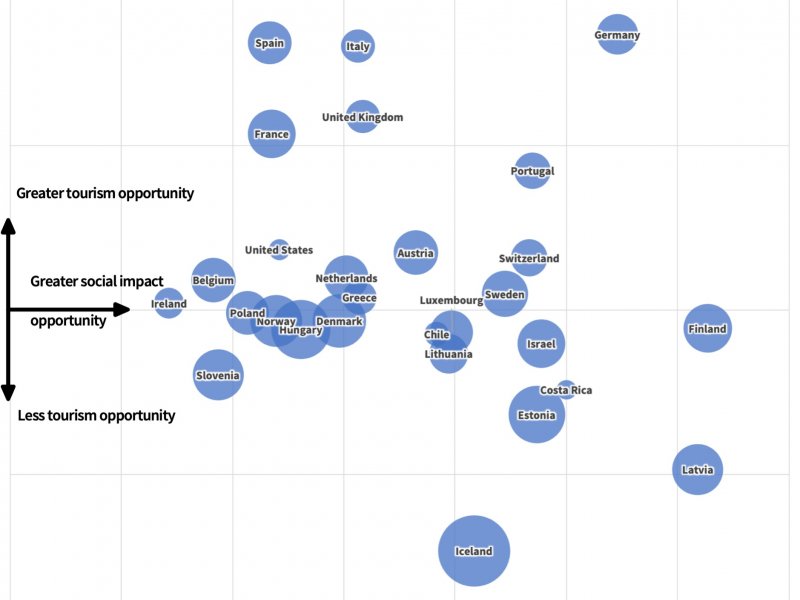
Outlined on previous pages in this report is a series of trends, which, with the right approach, might present opportunities for culture – opportunities for culture to support inclusive growth, where there is evidence that cultural interventions can be effective. How could we make sense of these opportunities, and work out where to prioritise efforts? As an attempt in this direction, the chart above gives a crude analysis of opportunities for the cultural sector on two axes: opportunities for inclusive growth through tourism and opportunities for inclusive growth achieving social impact (recognising they are far from discrete).
There aren’t widely accepted formulae for calculating economic opportunity, as we’ve encountered in use, but a loose definition is based on economic opportunityarising from the ability to meet a need or desire with some form of payment or return. So the data below use various data sets to estimate economic opportunity for the cultural sector, thus:
Opportunity = level of need * current cost of or gain from meeting that need * ability of culture sector to meet that need
For tourism, we have calculated:
- ‘Need’, using the WEF Travel and Tourism index, on the difference between a country’s ‘Cultural Resources and Business Travel’ score and the shortfall in its infrastructure’s ability to enable the maximisation of that resource (1 minus the total score; this means that ‘need’ can be negative, where the overall infrastructure score is greater than the resource score), assuming that need is proportionate to un-met potential;
- ‘Current cost/gain’ on the contribution of tourism to that country as a workforce employed in the culture sector, assuming the culture sector’s potential future capacity to support tourism is proportionate to its current size overall.
For social impact, we have calculated:
- ‘Need’ on the mean of a country’s GINI coefficient for income inequality, SIGI score for gender inequality, and percentage of non-enrolment in secondary education, assuming the need that might reasonably be partly met through culture is proportionate to these three measures in aggregate;
- ‘Current cost/gain’ on the percentage of government spending currently allocated to social protection and education, assuming that potential resource for the cultural sector serving these needs would be proportionate to the current costs of doing so (not, though, implying any expectation that governments will readily divert these budgets to the cultural sector);
- ‘Capacity of the cultural sector’, as for tourism, on the percentage of the workforce employed in the culture sector, assuming the culture sector’s potential future capacity to work deliberately and successfully towards social impact is proportionate to its current size overall.
We have also included (bubble size) the current level of government spending on culture as a percentage of GDP.
The chart shows countries for which data are available, which is predominantly OECD member countries.
The chart and its methods are crude but interesting, perhaps at least because it attempts to show not just the level of need in a country but the potential capacity to meet that need and the resource for doing so – the opportunity. On this basis, for example, Iceland, which has the strongest cultural sector government spending percentage has perhaps more future opportunity unrealised in supporting social impact than tourism, and Finland, Latvia and Germany have particular potential opportunities for cultural sector social impact support. USA has approximately the same social impact opportunity as Spain, France and Norway, despite much smaller government cultural spend (bubble size) and indeed social protection and education spend, because it has higher GINI and secondary non-enrolment figures.
Of course, there are numerous factors that this chart does not convey. One of the most significant is the expertise (or lack thereof) of the cultural sector in supporting social impact – which is by no means the same skillset as supporting culture itself – and an expertise where various commentators see the UK as having an advantage that the British Council has a key role in exporting. (E.g. UNESCO-UK's 2019 Cultural Heritage Innovation report.)